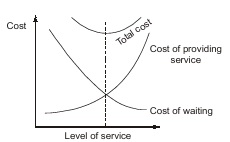
Graph of Optimization of Cost
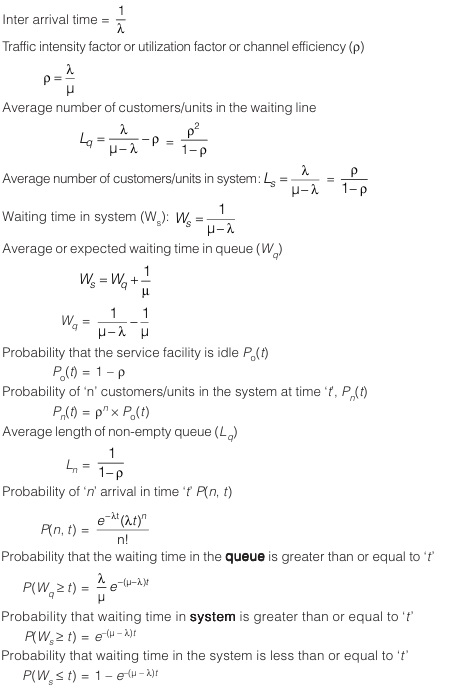
Representation of Queueing Model
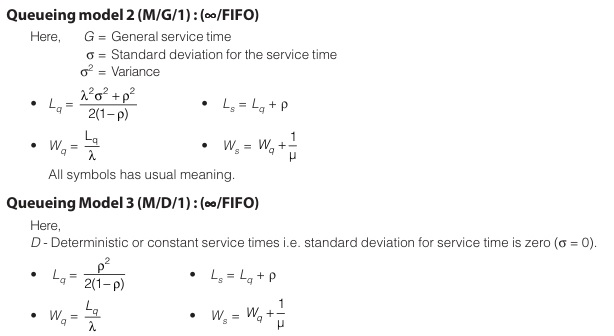
Kendalls Lee Notation:
The general form of notation is
(a/b/c ) : (d/e/f )
Here,
- a = Probability distribution for arrival pattern.
- b = Probability distribution for service pattern.
- c = Number of servers.
- d = Service rule or service order.e =
- number of customers allowed in the system
- f = Size of calling population.
Queueing Model 1 (M/M/1) : (FIFO/∞/∞)
- M=Arrival pattern with Poisson distribution.
- M=Service rate is exponentially distributed.
- 1 = Number of server.
- FIFO = Service rule,
- ∞ = customer number allowed
- ∞ = Size of calling population
Assumption (λ < µ): : When mean arrival rate (λ) is greater than mean service rate, there will be never ending queue and it leads to queue explosion.
Remember:
In queuing model the assumption is that, if random variable is independently and identically distributed random variable then only we can assume it as Poisson distribution.
<< Previous | Next >>
Must Read: What is Industrial Engineering?
Dear Aspirants,
Your preparation for GATE, ESE, PSUs, and AE/JE is now smarter than ever — thanks to the MADE EASY YouTube channel.
This is not just a channel, but a complete strategy for success, where you get toppers strategies, PYQ–GTQ discussions, current affairs updates, and important job-related information, all delivered by the country’s best teachers and industry experts.
If you also want to stay one step ahead in the race to success, subscribe to MADE EASY on YouTube and stay connected with us on social media.
MADE EASY — where preparation happens with confidence.
MADE EASY is a well-organized institute, complete in all aspects, and provides quality guidance for both written and personality tests. MADE EASY has produced top-ranked students in ESE, GATE, and various public sector exams. The publishing team regularly writes exam-related blogs based on conversations with the faculty, helping students prepare effectively for their exams.