LTI Systems
LINEAR TIME-INVARIANT (LTI) SYSTEMS
Systems with two basic properties viz. linearity and time-invariance are known as LTI systems. These systems are preferred because of two major reasons:
(i) Many physical processes though not absolutely LTI can be approximated with these properties.
(ii) The mathematical analysis becomes easier.
The LTI systems are always considered with respect to impulse response i.e. input is impulse, the output is impulse response.
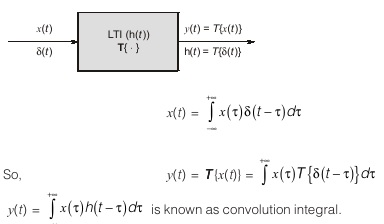
CONTINUOUS TIME LTI SYSTEMS
The Convolution Integral
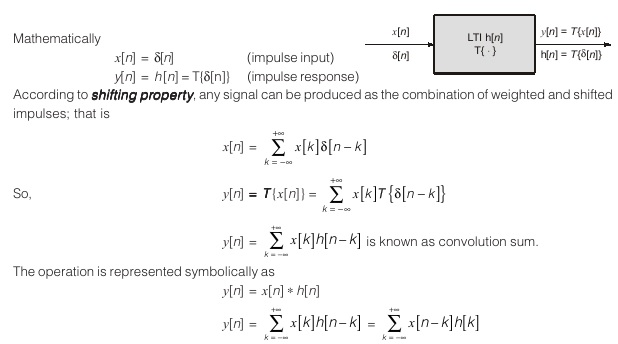
Mathematically,
x(t)=δ(t) … impulse input
y(t)=h(t) = T{δ(t)}
The complete characterization of continuous-time LTI system is done by unit impulse response.
According to shifting property, any signal can be produced as combination of weighted and shifted impulses that is
This operation is represented symbolically as
y(t)=x(t) ∗ h(t)
It is important to note that, the property of linearity allows the use of superposition principle and property of time-invariance made it possible to express the system response to δ(t – τ) as h(t – τ).
Methods to perform continuous-time convolution:
(a) Graphical method
(b) Analytical method
(a) Graphical method : Steps to perform continuous-time graphical convolution
- Obtain the limits of y(t)
Sum of lower limits ≤ t ≤ Sum of upper limits - Change the axis from ‘t’ to ‘τ’
- Folding or flipping {either x(–τ) or h(–τ)}
- Shifting {either x(–τ) or h(–τ)} to get x(t – τ) or h(t – τ)
- Multiplication of given signals {x(t) h(t – τ) or h(τ) x(t – τ)}
- Integrate with limits of y(t)
DISCRETE-TIME LTI SYSTEMS
The convolution sum
Methods to perform discrete-time convolution:
(a) Graphical method
(b) Analytical method
(a) Graphical method : Steps to perform discrete-time graphical convolution
- Represent graphically if signal is given in form of equation
- Obtain the limits of y[n]
sum of lower limit ≤ n ≤ sum of upper limit - Change the axis from ‘t’ to ‘k
- Folding (x[–k] or h[–k])
- Shifting (either x[–k] or h[–k] to get x[n – k] or h[n – k
- Evaluation: Get x[k] h[n – k] by varying ‘k’ and summarize all the results and sketch the resultant.
Dear Aspirants,
Your preparation for GATE, ESE, PSUs, and AE/JE is now smarter than ever — thanks to the MADE EASY YouTube channel.
This is not just a channel, but a complete strategy for success, where you get toppers strategies, PYQ–GTQ discussions, current affairs updates, and important job-related information, all delivered by the country’s best teachers and industry experts.
If you also want to stay one step ahead in the race to success, subscribe to MADE EASY on YouTube and stay connected with us on social media.
MADE EASY — where preparation happens with confidence.
MADE EASY is a well-organized institute, complete in all aspects, and provides quality guidance for both written and personality tests. MADE EASY has produced top-ranked students in ESE, GATE, and various public sector exams. The publishing team regularly writes exam-related blogs based on conversations with the faculty, helping students prepare effectively for their exams.