Shear Force and Bending Moment Diagram
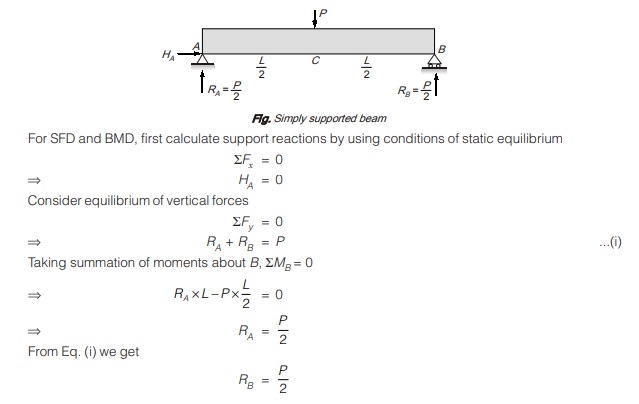
Shear force and bending moment diagrams represent variation of shear force and bending moment along the beam. Shear force diagrams and bending moment diagrams are abbreviated as SFD and BMD respectively.
Method of Section:
For SFD:
Portion AC:
Consider a section x-x in portion AC at distance x from A
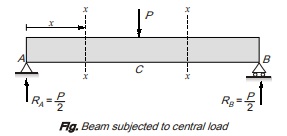
Shear force at section x-x, Sx (x from A) = RA {0 ≤ x < L/2}
It is clear that Sx is constant between support A and just to the left of C.
Portion CB:
Again considering section x-x in portion CB at a distance x from A
Shear force at section x-x, Sx (x from A)= +RA – P = P/2 – P = -P/2 {L/2 < x ≤ L}
It is clear that Sx is constant between just right of C to the support B.
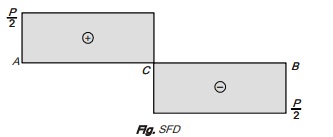
Shear force in AC is +P/2 and shear force in BC is -P/2. Hence shear force changes sign at C.
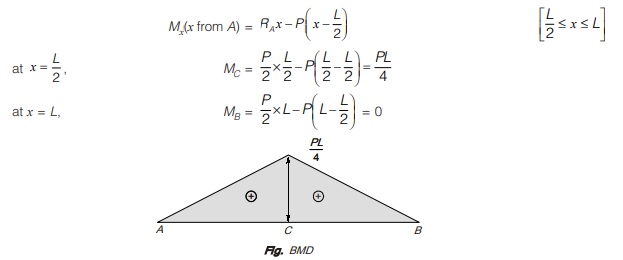
For BMD:
Portion AC:
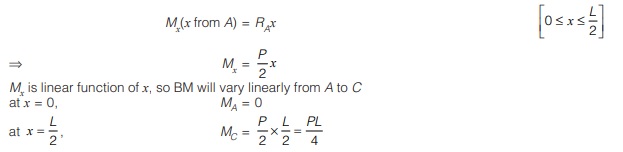
Again considering a section x-x in portion AC at a distance x from A,
Then bending moment at x-x is given by
Portion CB:
Again consider a section x-x in portion CB at a distance x from A then bending moment at x-x is given by
CURVE TRACING FOR SFD AND BMD
Suppose, SF/BM = y(x) = Ax3 + Bx2 + Cx + D
then, dy/dx = 3Ax2 + 2Bx + C
Check dy/dx:
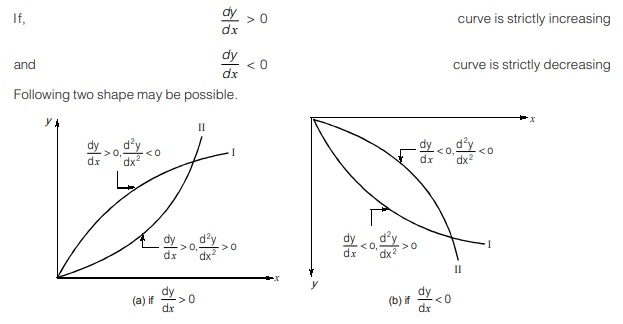
Check for Concavity:
Check d2y/dx2
If, d2y/dx2 > 0 Concave up
and d2y/dx2 < 0 Concave down
RELATIONSHIP BETWEEN LOAD, SHEAR FORCE& BENDING MOMENT
When there is no concentrated load or moment
(i) Shear force: Consider a simply supported beam of length L subjected to a uniformly distributed load of intensity w kN/m throughout its length as shown in figure (a)
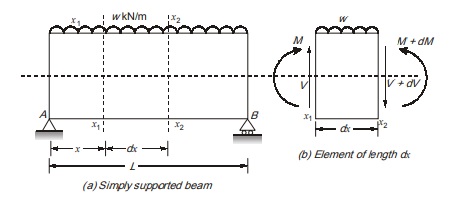
Consider a small portion of length dx at a distance x from A between section x1 and x2.
Let the uniformly distributed load produces moment M and shear force V at section x1 and moment M + dM and shear force V + dV at section x2 respectively as shown in figure (b).
Considering equilibrium of portion dx.
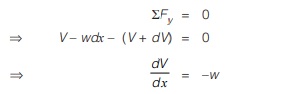
Negative sign in eq. (i) implies that loading is downward.
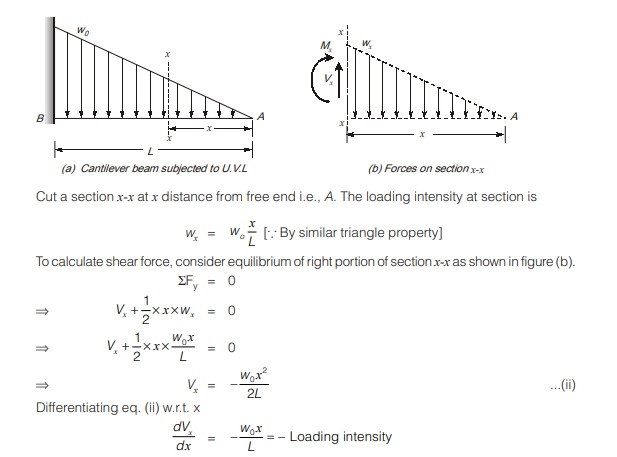
To illustrate use of eq. (i), consider a cantilever beam of length L subjected to uniformly varying load whose intensity increases from zero at free end to w0 kN/m at fixed end linearly as shown in figure (a)
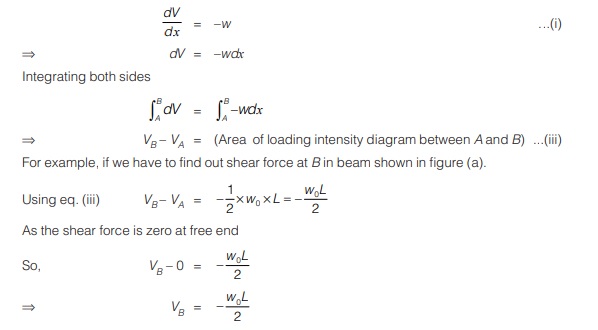
As derived earlier in eq. (i)
Eq. (i) can also be used to calculate difference of shear force between two sections along the length of beam by finding the area of loading intensity between the sections.
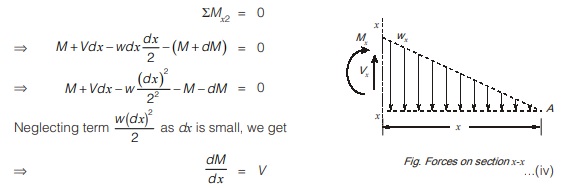
(ii) Bending moment: Consider the equilibrium of portion dx beam element shown in figure
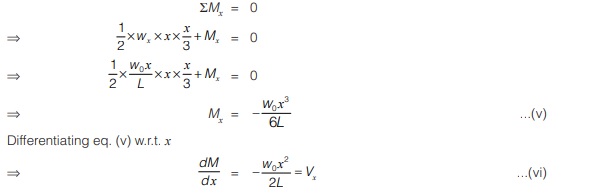
To illustrate use of eq. (iv), consider the cantilever beam as shown in figure (a). At section x-x which is at distance x from free end as shown in figure (b). Loading intensity at section x-x,
Wx = W0x/L
To calculate bending moment, consider rotational equilibrium of right portion of section x-x as shown in figure (b).
As derived earlier in eq. (iv)
Eq. (iv) can also be used to calculate difference of bending moment between two section along length of beam by finding the area of shear force diagram between A and B.
dM/dx = V
dM = Vdx
Integrating both sides ![]()
MB – MA = Area of shear force diagram between A and B
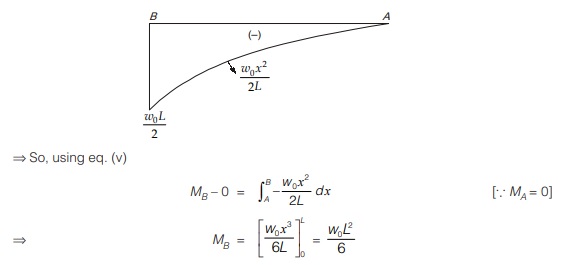
For example, if we have to find out bending moment at B in beam shown in figure (a).
Using eq. (v)
MB – MA = Area of shear force diagram between A and B
To draw shear force diagram of beam in figure
Vx = W0x2/2L
So, its SFD will be parabolic as shown in figure (e)
SFD
IMPORTANT POINTS ABOUT SHEAR FORCE DIAGRAMS AND BENDING MOMENT DIAGRAMS DERIVED FROM RELATIONSHIP
- SFD is one degree higher than loading intensity diagram and BMD is one degree higher than SFD.
- Area of loading intensity diagram between two sections gives the difference of shear force at the sections.
- Area of shear force diagram between two sections gives the difference of bending moment at the section.
- Slope of shear force diagram at a section gives loading intensity at that section.
- Slope of bending moment diagram at a section gives shear force at that section.
- If at point a concentrated load or reactions acts than ordinates of SFD will change by magnitude of that load.
- If at a point concentrated moment acts, then ordinate of BMD will change by magnitude of that couple.
- If shear force changes sign at a section, then BM at that section is either maximum or minimum but inverse is not true.
- If bending moment changes sign at a section, then curvature will also change at that section. Such a point is called point of contraflexure and same point is called point of inflection on elastic curve.
Remember:
- The distance between two adjacent point of contraflexure is known as focal length.
- The portion of beam in which shear force is constant is known as shear span.
<< Previous | Next >>
Must Read: What is Strength of Material?
Dear Aspirants,
Your preparation for GATE, ESE, PSUs, and AE/JE is now smarter than ever — thanks to the MADE EASY YouTube channel.
This is not just a channel, but a complete strategy for success, where you get toppers strategies, PYQ–GTQ discussions, current affairs updates, and important job-related information, all delivered by the country’s best teachers and industry experts.
If you also want to stay one step ahead in the race to success, subscribe to MADE EASY on YouTube and stay connected with us on social media.
MADE EASY — where preparation happens with confidence.
MADE EASY is a well-organized institute, complete in all aspects, and provides quality guidance for both written and personality tests. MADE EASY has produced top-ranked students in ESE, GATE, and various public sector exams. The publishing team regularly writes exam-related blogs based on conversations with the faculty, helping students prepare effectively for their exams.