Seepage Through Earthen Dams
Figure shows a typical section of an earthen dam. A typical flow net of seepage through its body is also shown in figure.
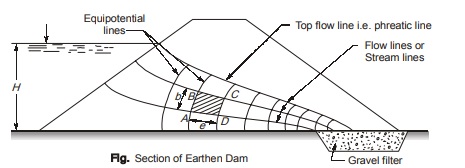
- The top most flow line is called the line of seepage or phreatic line. Soil mass below the phreatic line is completely saturated whereas soil above is either capillary saturated or partially saturated.
- Pressure above and on the phreatic line is atmospheric and pressure below the phreatic line is hydrostatic.
- Phreatic line follows the path of base parabola.
Vertical Stress Isobar Diagram 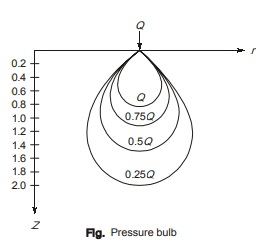
- Stress Isobar is a curve or contour joining the points of equal vertical pressure in the soil mass.
- Since the vertical stress on a given horizontal plane is the same in all directions at points located at equal radial distances from the axis of loading.
- This isobar is spatial curved surface and resembles a onion bulb in shape, hence it is also called pressure bulb.
- With the increasing of depth, vertical stress reduces. Hence, generally effect of vertical stress beyond the zone of 0.20 Q isobar is neglected.
Vertical Stress Distribution Diagram on Horizontal Plane
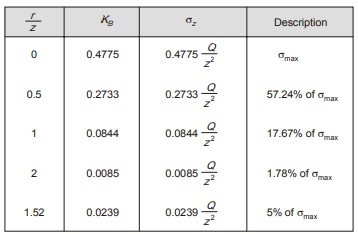
- Vertical pressure distribution diagram on the horizontal plane at a constant depth of ‘z’ can be analyzed by using the vertical pressure given by Boussinesq theory.
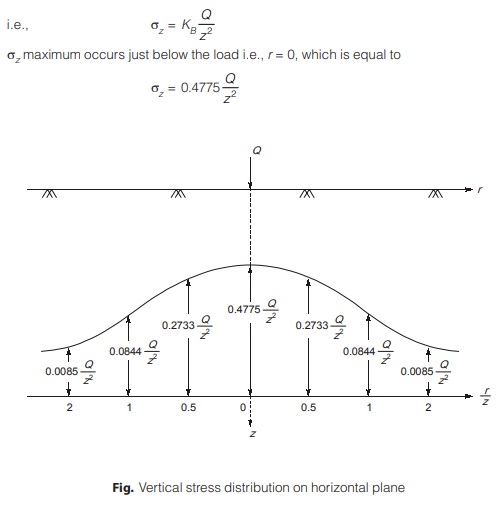
- Vertical stress distribution diagram on a horizontal plane is bell-shaped; the maximum stress is just below the line of action of the concentrated load and stress decrease is asymptotic.
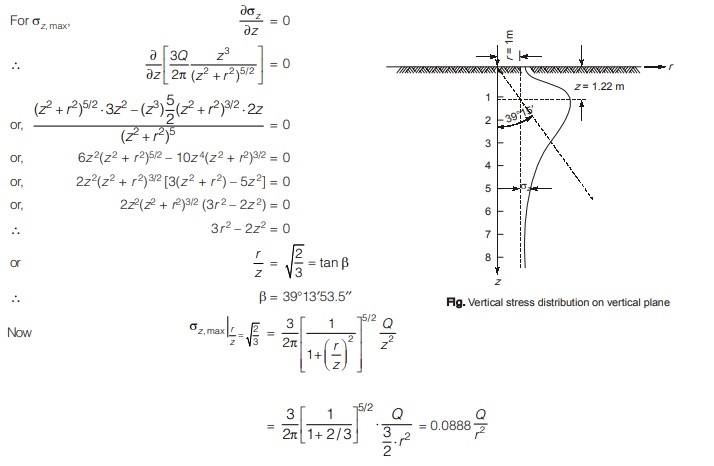
Vertical Stress Distribution Diagram along Vertical Line
- Vertical pressure on the vertical line first increases with increase in depth and reaches upto its maximum value and starts decreasing beyond it with further increase in depth.
- Maximum vertical pressure on vertical line occurs when the angle β made by the polar ray attains a value of 39°13′53.3′′ from the point load.
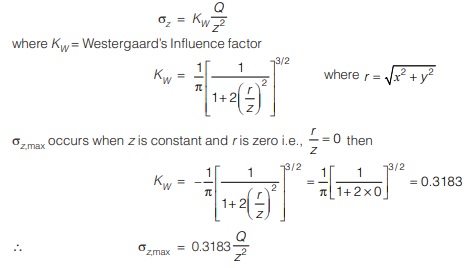
Assumptions of Westergaard’s theory
- Medium is assumed to be homogeneous, semi-infinite, stratified, elastic and non-isotropic.
- Medium is assumed to be laterally reinforced with fibres of negligible thickness i.e., medium is considered to be rigid horizontally and elastic vertically. It means no lateral deformations but only vertical deformations takes place.
• Westergaard equation for vertical stress for a point load, for a Poisson’s ratio value equal to zero is given by
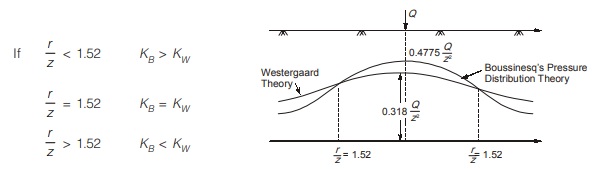
COMPARISON BETWEEN BOUSSINESQ AND WESTERGAARD THEORIES
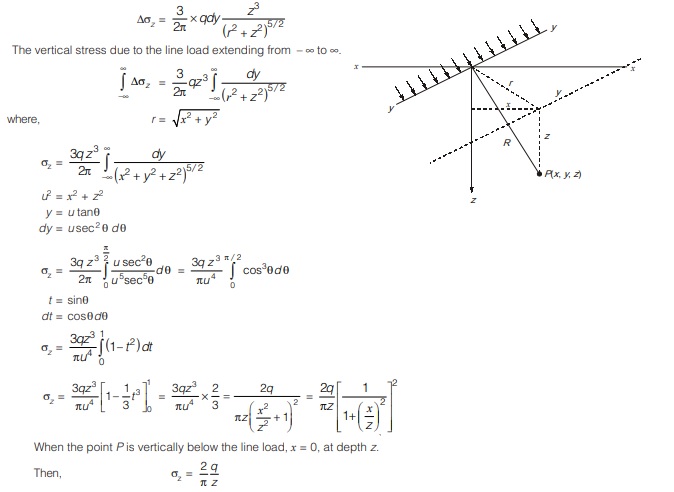
Vertical stresses due to a uniform line load
- The vertical stresses in a soil mass due to vertical line load can be obtained using Boussinesq’s solution.
- If the line load of intensity q per unit length, parallel to y-axis on the surface of a semi infinite elastic medium, the vertical stress σz at a point O.
- Let us consider the load acting on a small element of length dy.
- The load can be taken as a point load of intensity qdy.
- Boussinesq’s equation can be applied to determine the vertical stresses at P(x, y, z).
Vertical Stress Distribution below Uniformly Loaded Circular Area
- Consider a uniform load of intensity q acting over a circular area of radius R on the surface of a semi infinite soil mass.
- Boussineq’s equation can be used to determine σz.
- The load on the elementary ring of radius R and width dr is equal to q (2πr) dr.
- The load acts as a constant radial distance r from the point P.
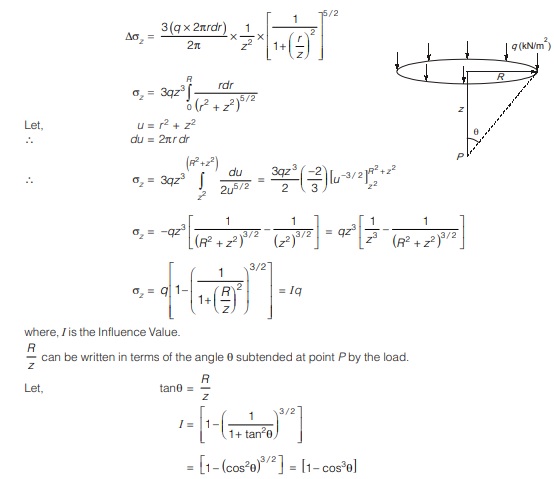
- From the above result it is observed that as θ = 90°, I = 1, i.e. for a very large uniformly loaded area in comparison to depth z, the vertical stress at a point P is approximately equal to q.
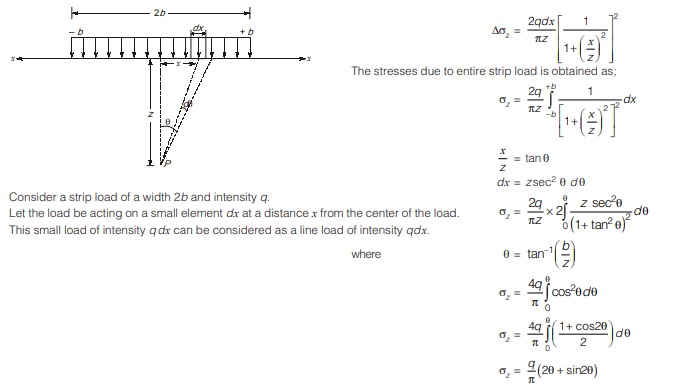
Vertical stress due to strip load
- The expression for vertical stress at any point P under a strip load can be developed from the equation of line load.
- The expression will depend on whether the point P lies below the center of the strip load or not.
Case I: Point P below the center of the strip.
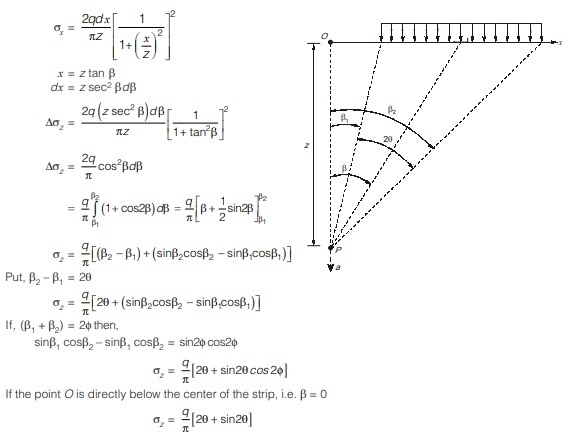
Case II: Point P not below the center of strip
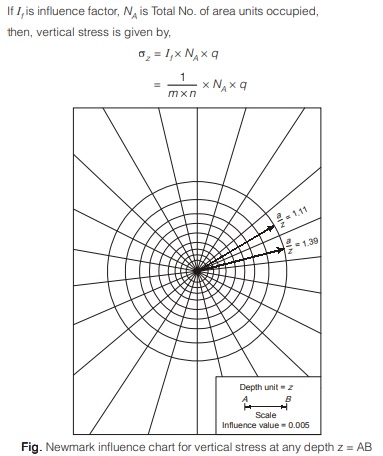
Newmark’s Influence Chart Method
- In this method, soil is assumed to be homogenous, semi-infinite, elastic and isotropic.
- These charts are based on Boussinesq’s equation so these charts are not applicable for stratified soils.
- The greatest advantage of this method is that it can be used for any shape of the loaded area.
- The influence chart consists of a number of concentric circles and radial lines which divides it into different area units where influence of each area unit at the centre of the chart is same and is referred as influence factor.
- Generally, 10 concentric circles and 20 radial lines are considered which divides it into 200 area units.
I = 1 / m x n
where m = No. of concentric circles, n = No. of radial lines
Here, I = 1 / 10 x 20 = 1 / 200 - In order to use the influence chart for the determination of vertical stresses at any point below a uniformly loaded area of any shape, the following steps are followed.
1. Draw the plan of the loaded area with a scale such that the depth z at which stress is being computed equals the length AB shown on the chart.
2. This plan of the loaded area is then kept on the influence chart such that point at which stress are required, coincides with the centre of the chart.
3. Count the number of area units covered by the plan area on the influence chart including the fractional ones.
If I is influence factor, NA is Total No. of area units occupied,
then, vertical stress is given by,
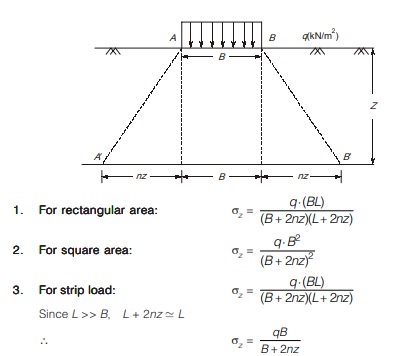
Trapezoidal Method/Load Strip Method
- It involves assumption that the stresses get distributed uniformly on the areas the edges of which are obtained by taking the angle of distribution as 1 vertical to n horizontal.
- Generally, 2V : 1H spread is considered below the loaded area.
<< Previous | Next >>
Must Read: Soil Mechanics and Foundation Engineering
Dear Aspirants,
Your preparation for GATE, ESE, PSUs, and AE/JE is now smarter than ever — thanks to the MADE EASY YouTube channel.
This is not just a channel, but a complete strategy for success, where you get toppers strategies, PYQ–GTQ discussions, current affairs updates, and important job-related information, all delivered by the country’s best teachers and industry experts.
If you also want to stay one step ahead in the race to success, subscribe to MADE EASY on YouTube and stay connected with us on social media.
MADE EASY — where preparation happens with confidence.
MADE EASY is a well-organized institute, complete in all aspects, and provides quality guidance for both written and personality tests. MADE EASY has produced top-ranked students in ESE, GATE, and various public sector exams. The publishing team regularly writes exam-related blogs based on conversations with the faculty, helping students prepare effectively for their exams.